What Is Sector Rotation Monitor? A Beginner's Guide to Smarter Investing
The Problem Most Investors Face
Most people ask, "What stock should I buy?"
Professionals ask, "Which part of the market is attracting capital inflows or outflows right now?"
That difference matters. The market is not one market. It is multiple groups rotating in and out of leadership. Sector Rotation Monitor helps you detect that rotation early, then move from sector-level signal to ETF or stock-level execution with a repeatable process.
What Is Sector Rotation?
Sector rotation is the movement of capital from one segment of the market to another as growth, inflation, rates, liquidity, and risk appetite change.
Simple examples:
- Strong growth and risk-on: Tech, Financials, Consumer Discretionary often lead.
- Slowdown and risk-off: Utilities, Staples, Healthcare often hold up better.
- Inflation pressure: Energy and Materials can strengthen.
Sector Rotation Monitor turns that macro idea into a daily decision framework.
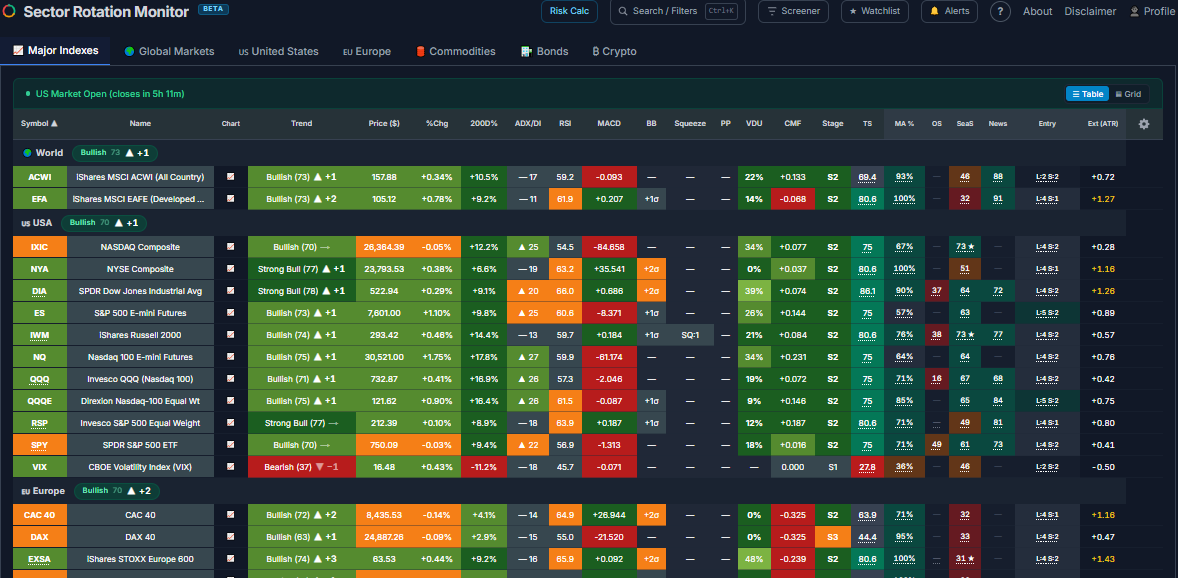
Check the Broad Market and Macro Environment First
Before looking at which sectors are rotating, spend 60 seconds on the bigger picture. A sector can look technically strong but still struggle if the macro backdrop is deteriorating. Sector Rotation Monitor gives you five quick views for this:
Major Indexes — a live snapshot of how the S&P 500, Nasdaq, Russell 2000, and Dow Jones are trending right now, each with a composite technical score. If the broad market is below its 200-day SMA and RSI is falling, you want to be more selective with everything below it.
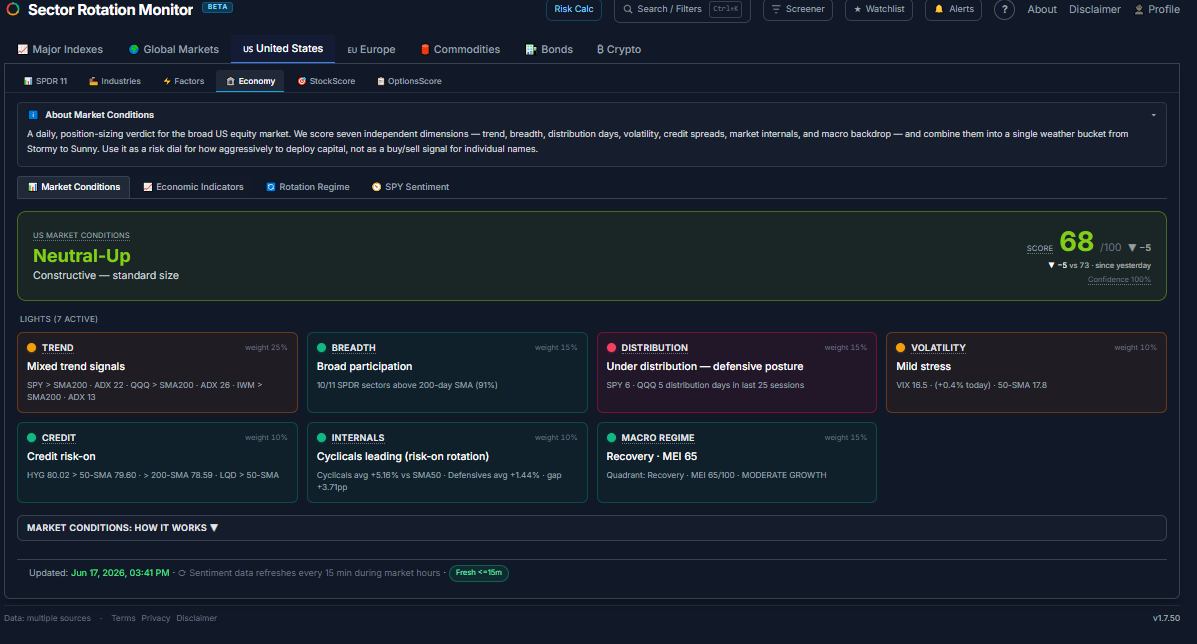
The Market Conditions page is our daily read on the tape — Breadth, Trend, Momentum, Sentiment and Volatility distilled into one regime score so you know whether the market is offering tailwind, headwind, or chop before you take a single trade. Use it as your pre-market checklist: green regime → press winners and add risk, red regime → tighten stops, raise cash, and wait for the next setup.
Macro Economic Indicator (MEI) — a composite score blending leading economic data (yield curve, PMI, credit spreads, inflation trends) into a single regime reading. A rising MEI favours growth sectors; a falling MEI shifts the edge to defensives.
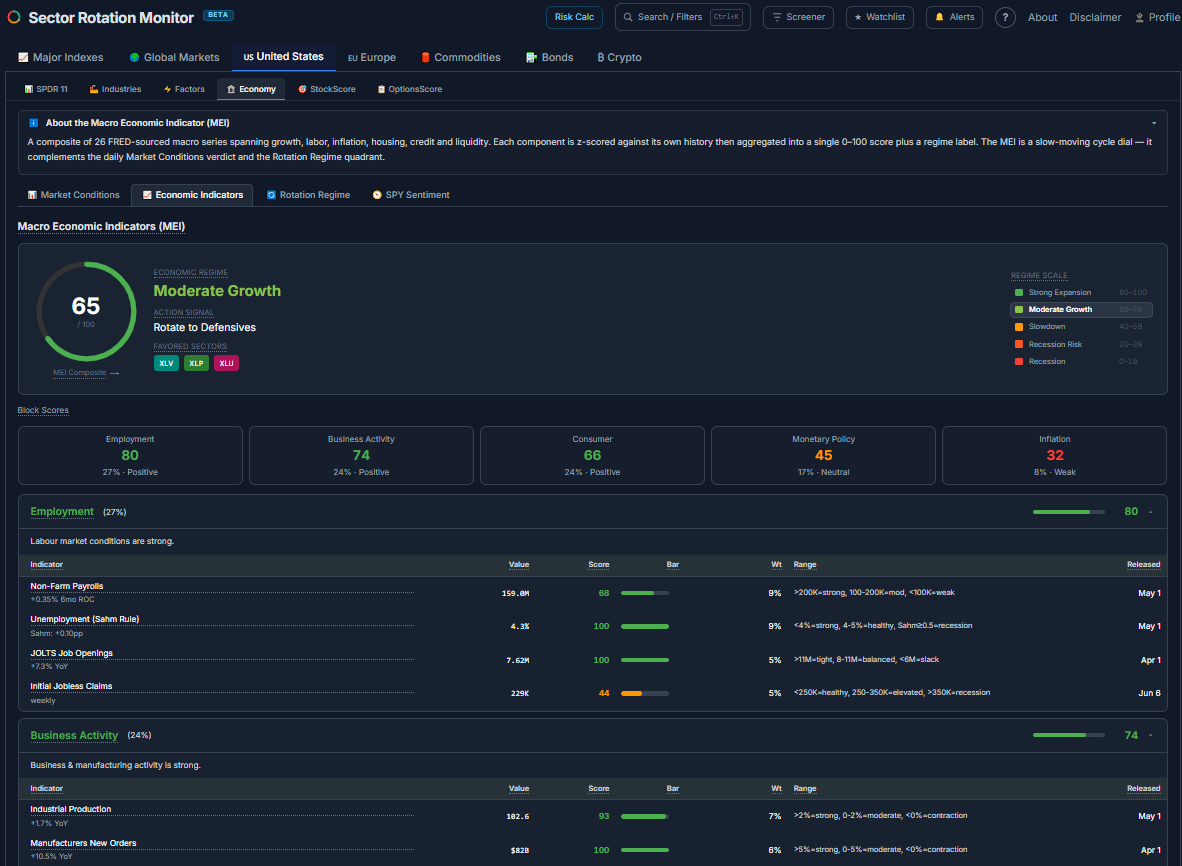
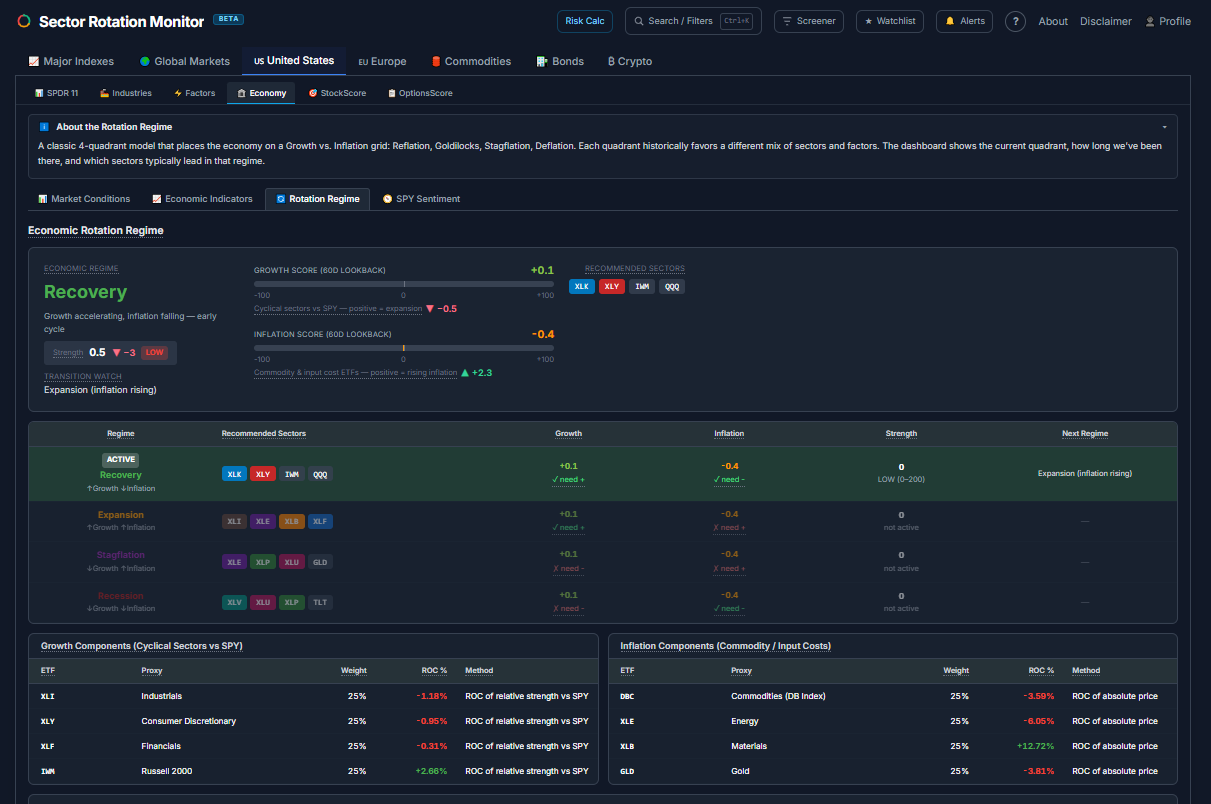
Economic Regime — a four-quadrant model (Expansion / Slowdown / Contraction / Recovery) showing where the economy is in its cycle. Each quadrant historically favours different sector groups, giving you a fast cross-check before you act.
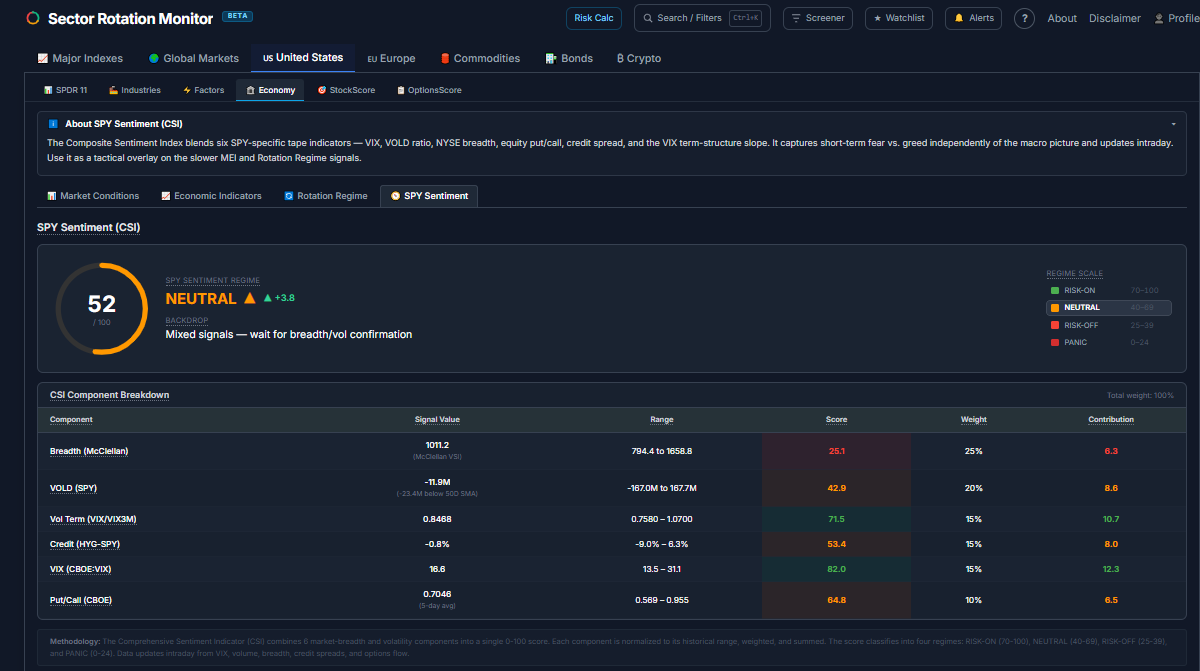
Market Sentiment — tracks options-market positioning and breadth signals across the US universe. Extreme fear can signal opportunity; extreme greed calls for tighter stops.
Together these five pages take under a minute and dramatically improve the quality of every sector decision that follows. Think of them as your pre-flight checklist.
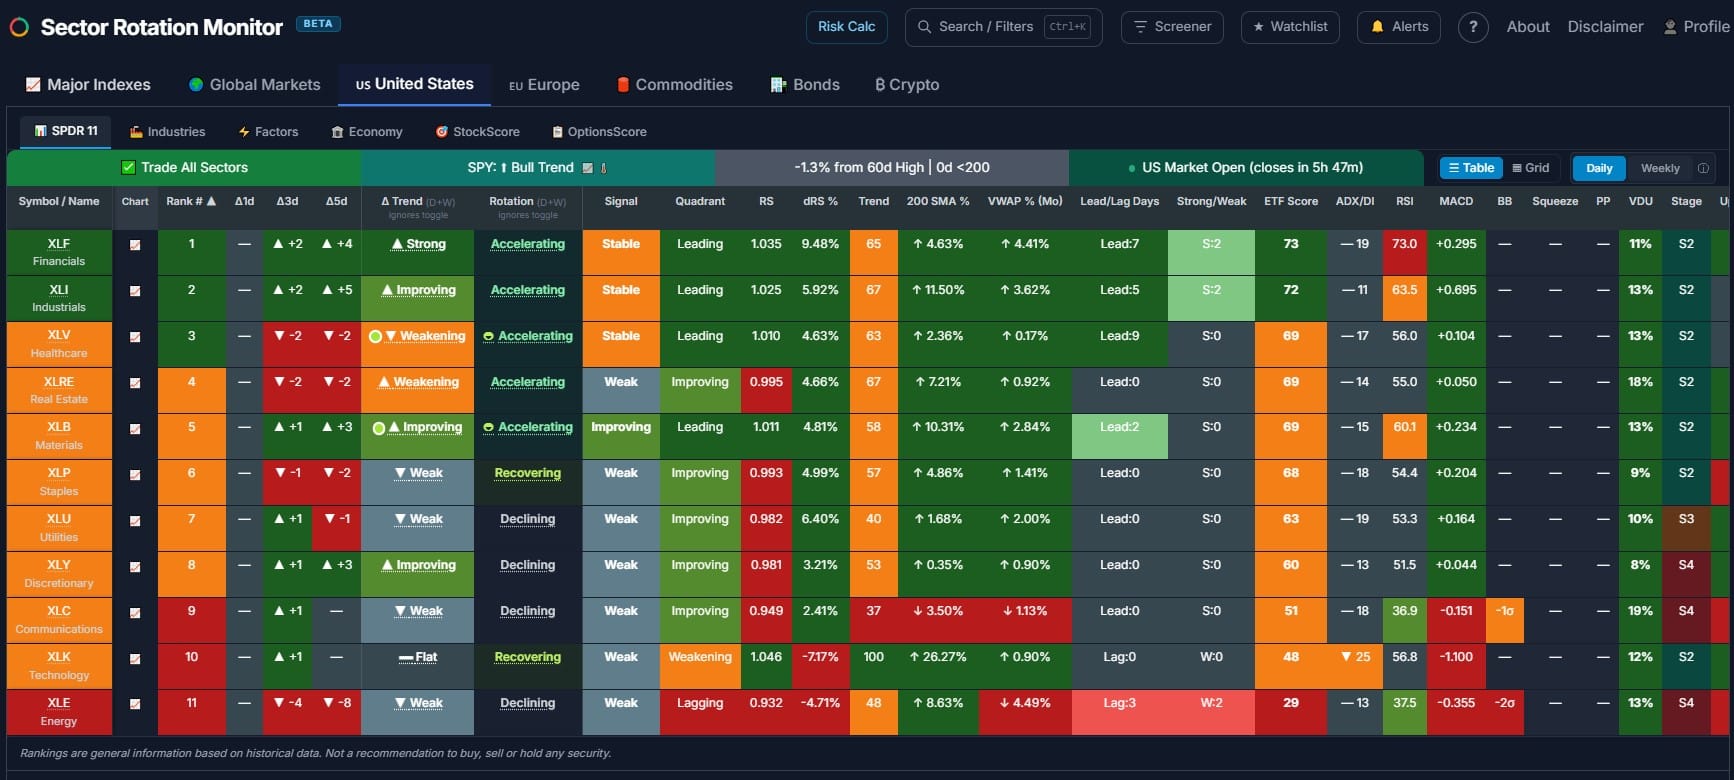
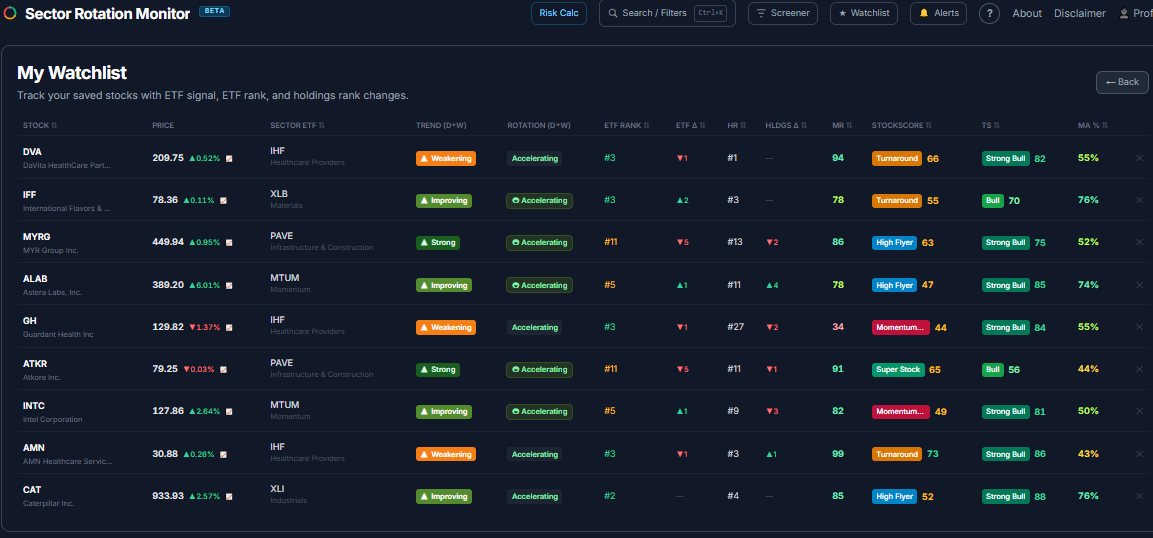
Read the Sector Rankings
Each update gives you:
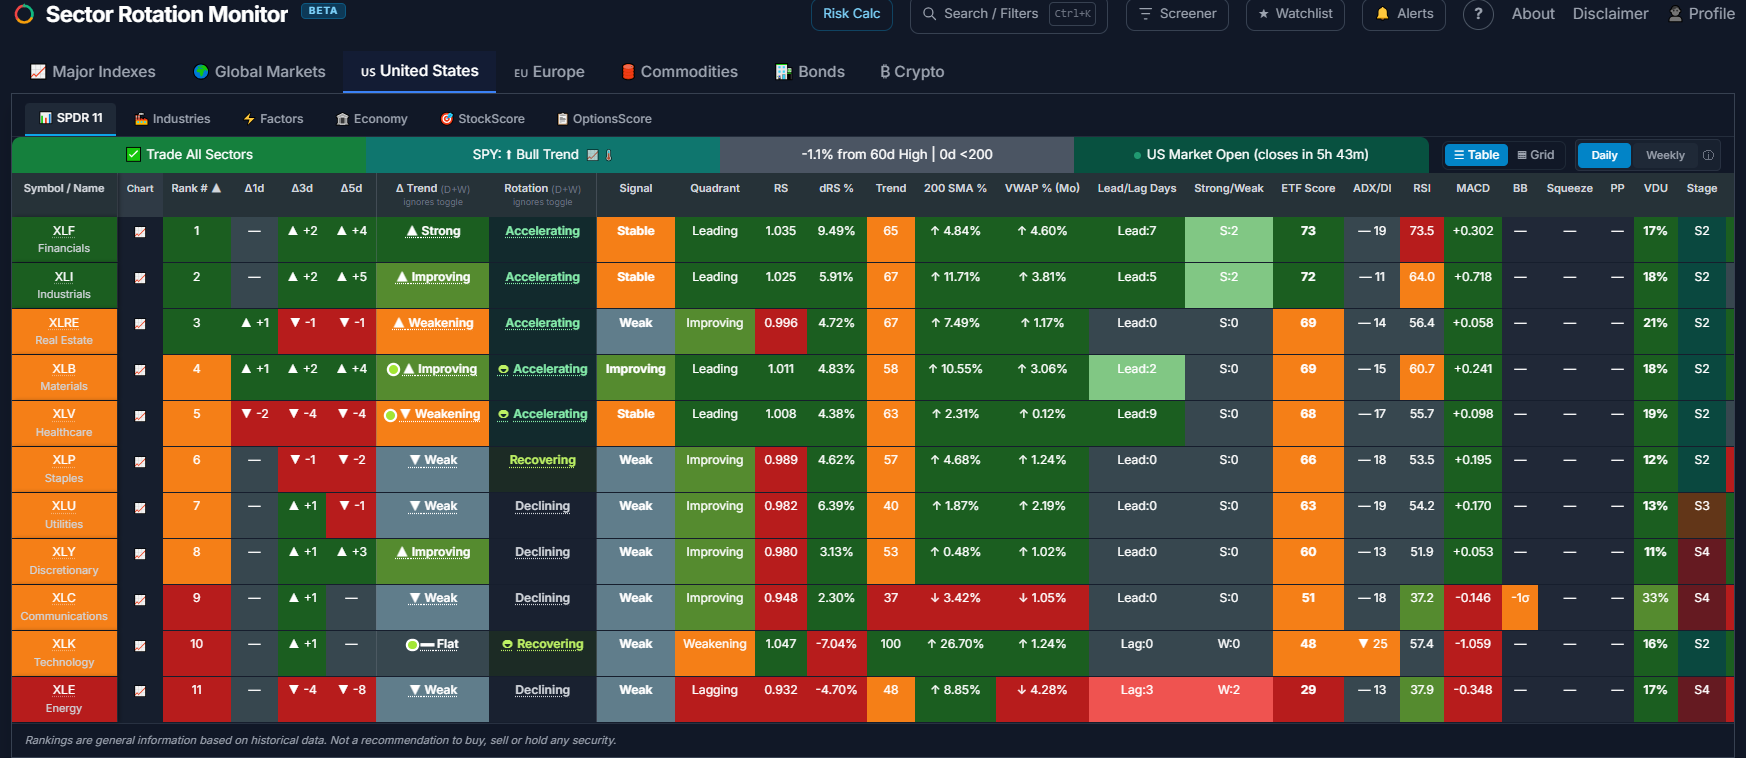
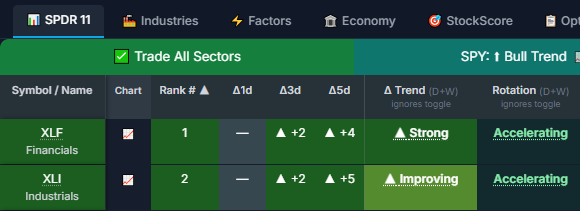
- Sector ranks and composite scores.
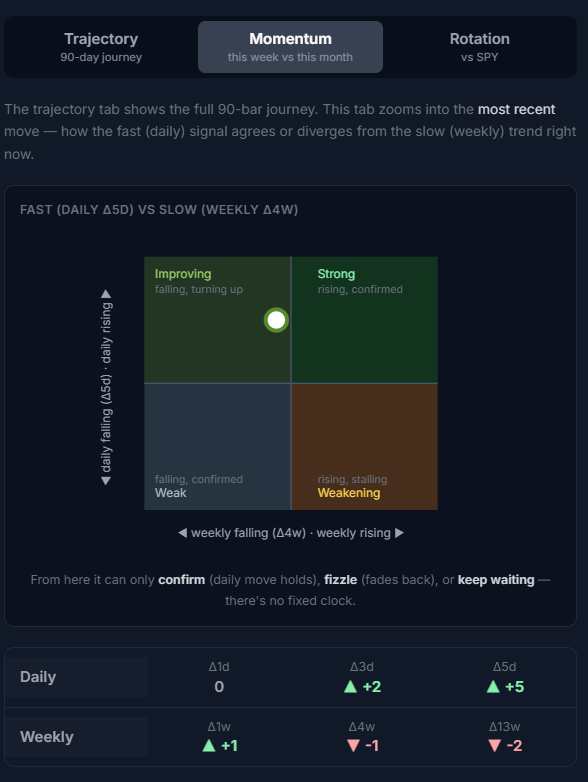
- Sector signal state daily (for example STRONG, IMPROVING, STABLE, WEAK).
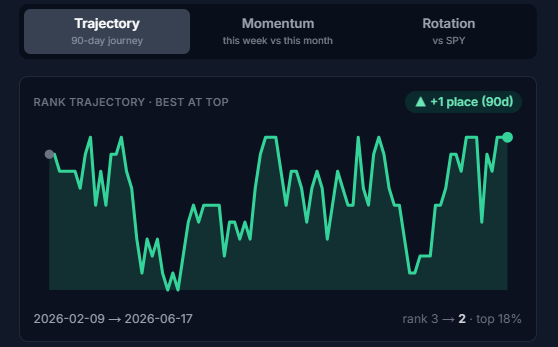
- Trend (D + W) Signal (90 days of trend signal)
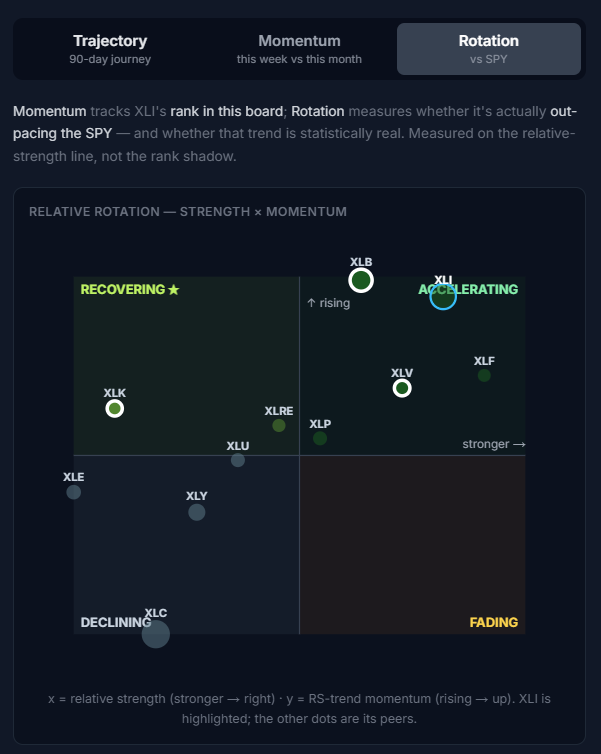
- Rotation - check if the sector is accelerating or weakening based on 90 days of rotation data.
- Regime context (risk-on, balanced, defensive conditions).
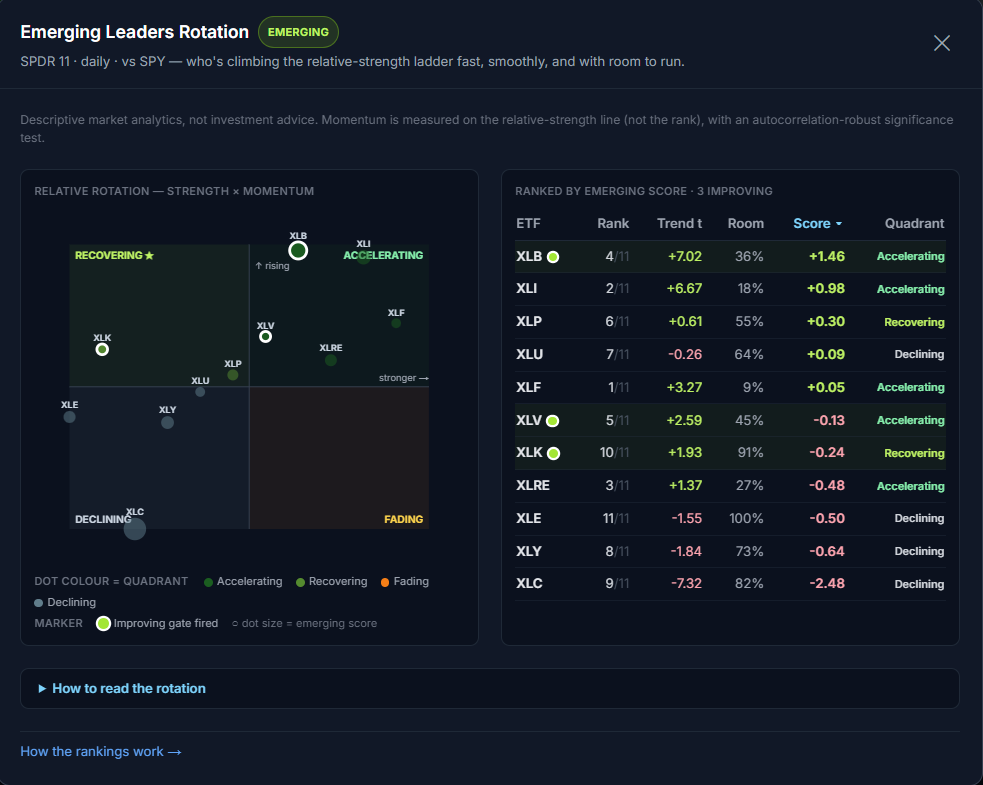
- The sectors that are not only top-ranked, but also climbing fastest.
That fourth point is key.
Identify Your Opportunity: Top Rank vs Rank Velocity
You can identify attractive sectors in two ways:
- Top-ranked leader: A sector already near rank 1-3 with strong breadth and confirmation.
- Fast-rising challenger: A sector jumping up the table quickly over recent intervals.

Why the second can be powerful:
- You may catch the move earlier, before broad participation and before media attention.
Why the second can be riskier:
- Early rotation can fail.
- Some jumps are short-covering spikes or news-driven overextensions.
In other words: rank velocity and acceleration can front-run opportunity, but it needs tighter risk controls.
Choose Your Execution Path: ETF or Stock
Once a sector is selected, you have two execution paths.
Path A: Trade the sector ETF
Use when:
- You want simpler exposure.
- You want lower single-name risk.
- You prefer one instrument with cleaner risk management.
Path B: Drill into holdings and select a stock
Use when:
- You want potentially higher alpha than ETF beta.
- You are comfortable selecting and managing single-name positions.
The platform already pre-ranks holdings so you can focus on top candidates first.
Filter Holdings by Confluence
Filter and select holdings using ranking and confluence tools.
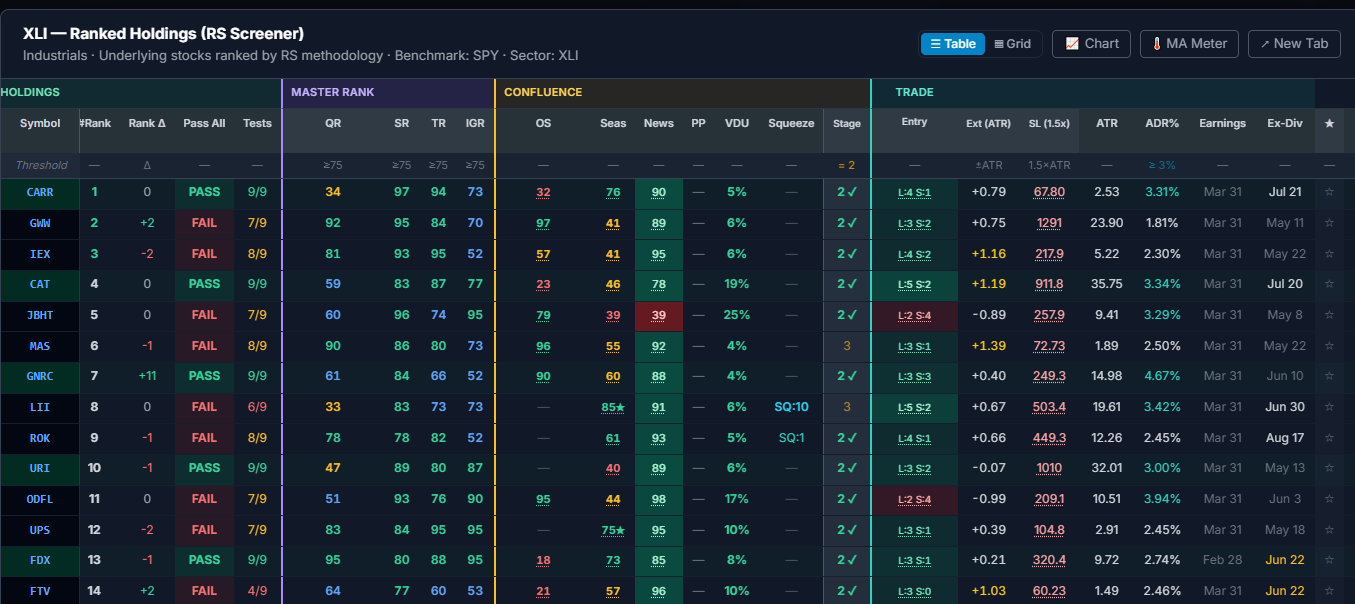
Inside a chosen sector, rank and filter candidates by confluence:
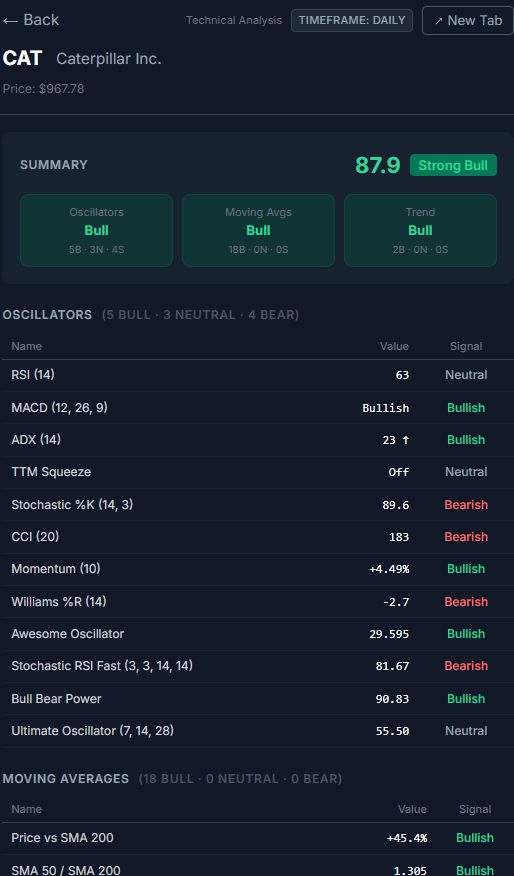
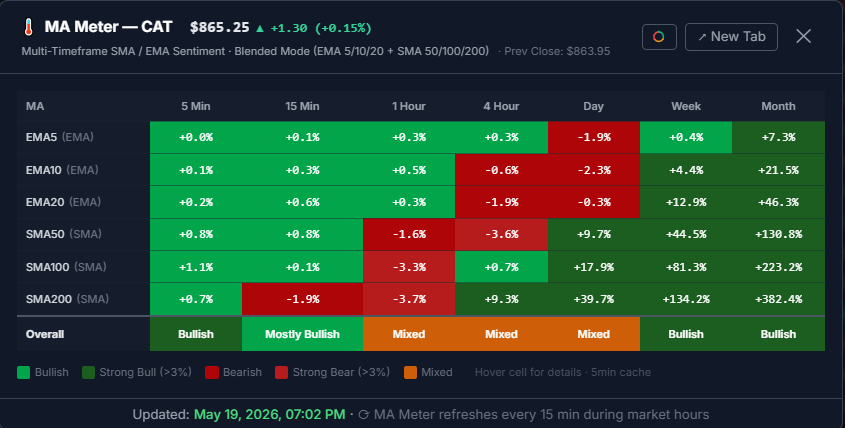
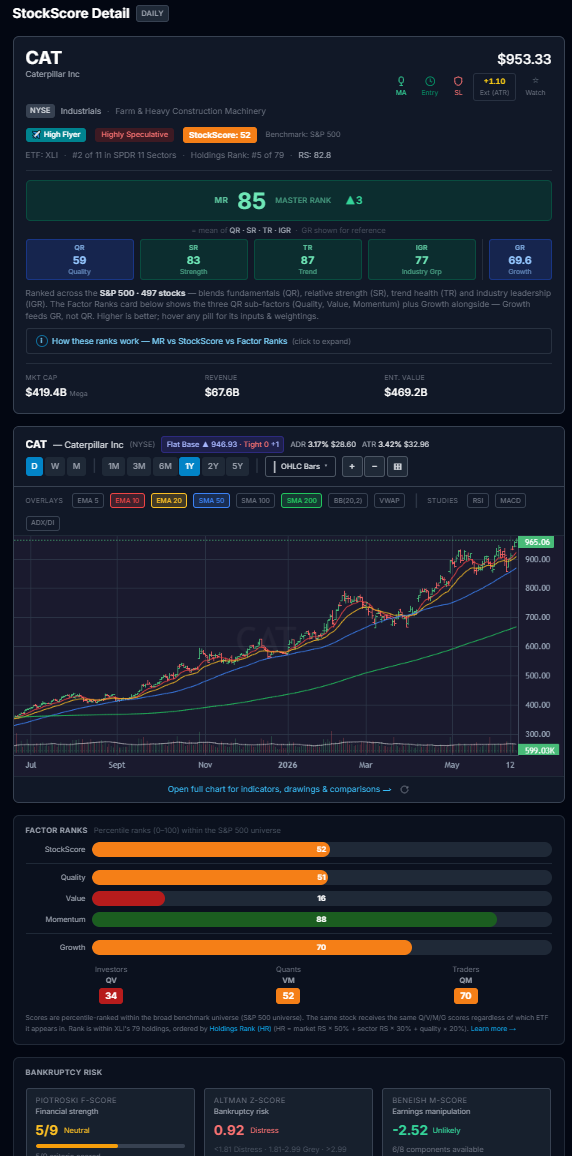
- Strong technical score
- Strong Market Rank and Stock Score
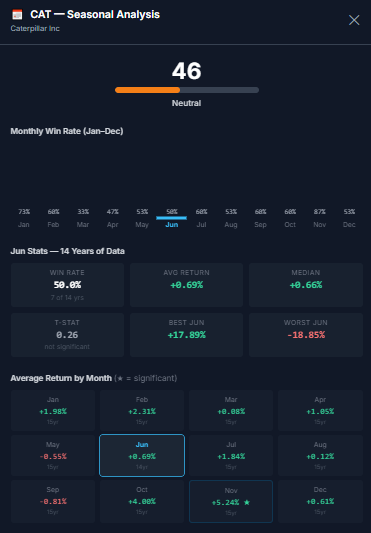
- Seasonal tailwind (if available).
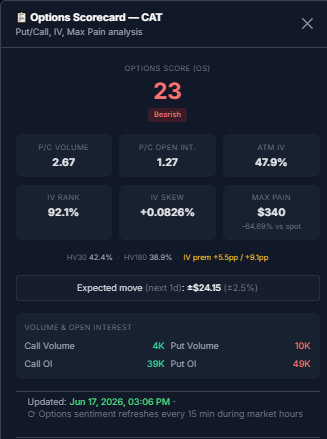
- Options sentiment confirmation (if available).
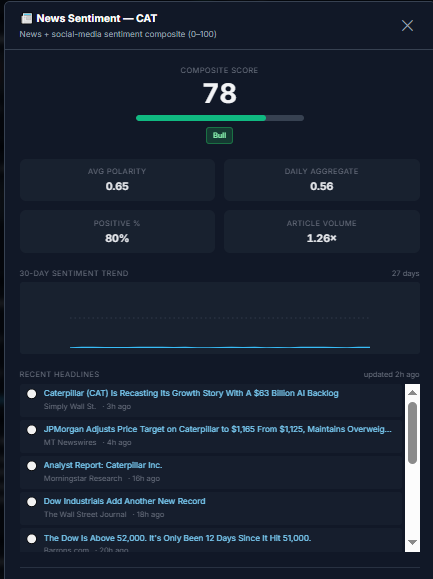
- News Sentiment Score
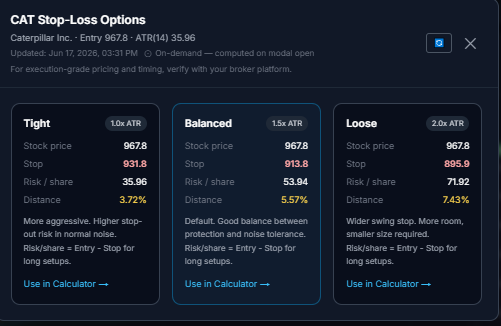
- Extension check (not excessively stretched vs ATR and 10 EMA threshold).
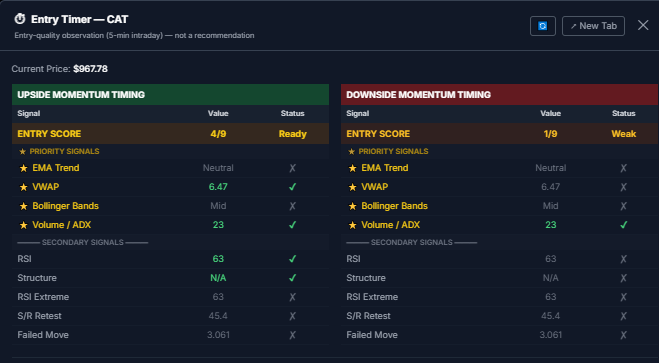
- Positive entry signal.
- Select stop loss position
- Add stock to Watchlist to monitor when sectors and or stocks are climbing or dropping in the rankings
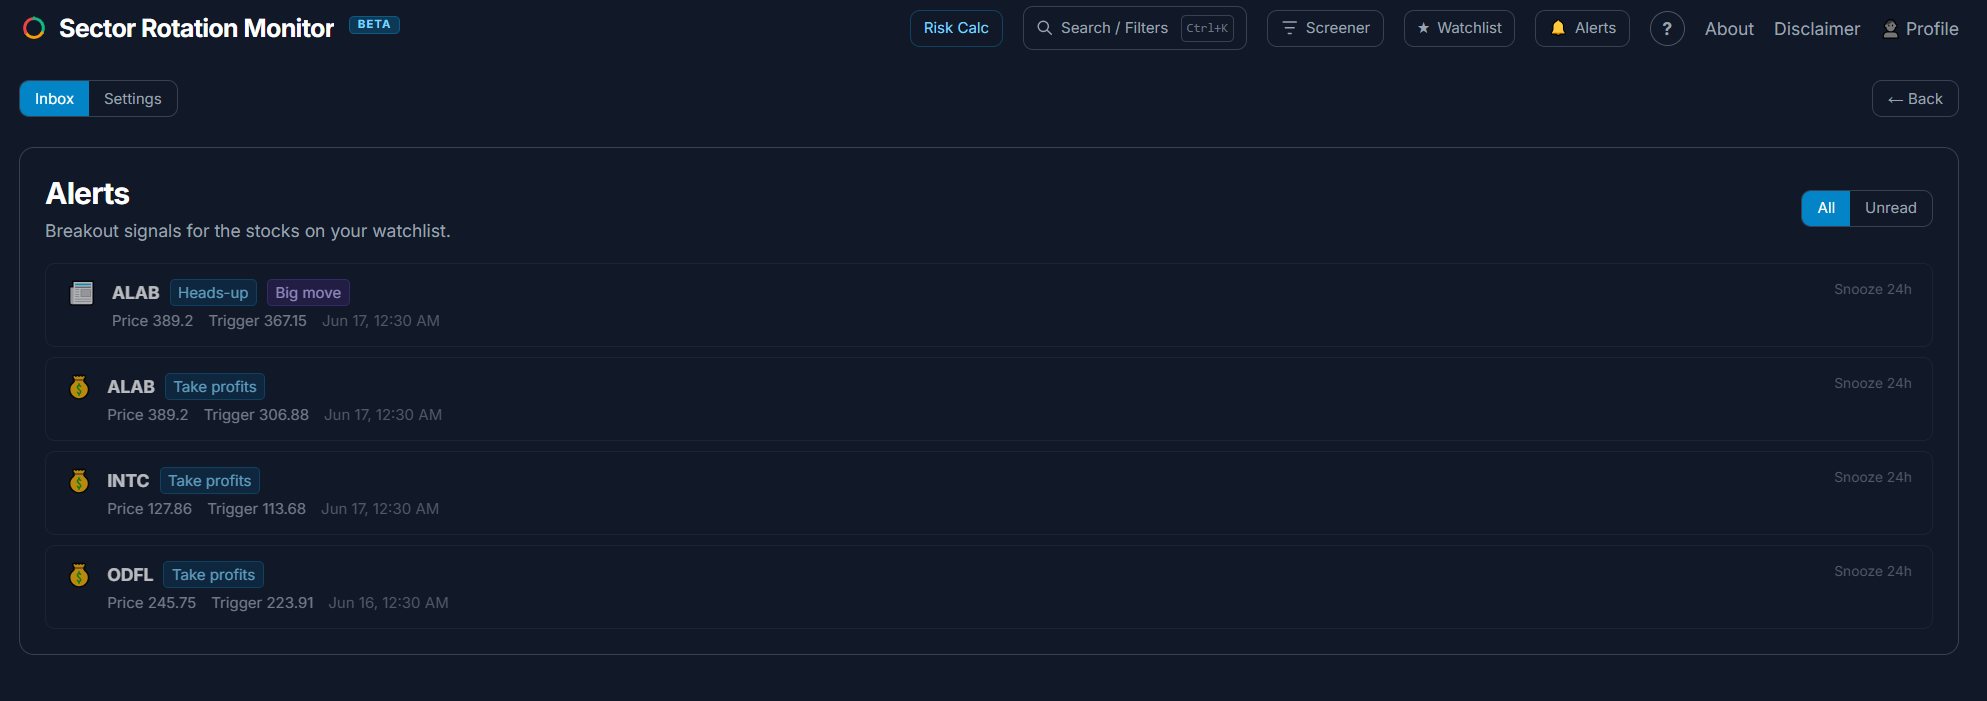
- Receive alerts when your Watchlist stocks break out, when your sectors start fading, and when whole-market conditions shift — so you act on the move, not after it.
Practical interpretation:
- High score + low extension + positive entry = cleaner setup.
- High score + extreme extension = potential continuation, but worse reward-to-risk.
- Fast-rising name with weak confluence = watchlist, not automatic entry.
Make the Entry Decision
After identifying a candidate, decide in this order:
- Is the Broad Market Context favourable (e.g. Bullish)?
- Is sector context still supportive?
- Is the stock among top-ranked names in that sector?
- Does confluence meet your minimum checklist?
- Is extension acceptable for your style?
- Is entry signal positive now?
- Does the trade fit your predefined risk budget?
If any of these fail, skip or wait. No setup is still a decision.
Example Flow (Fast but Robust)
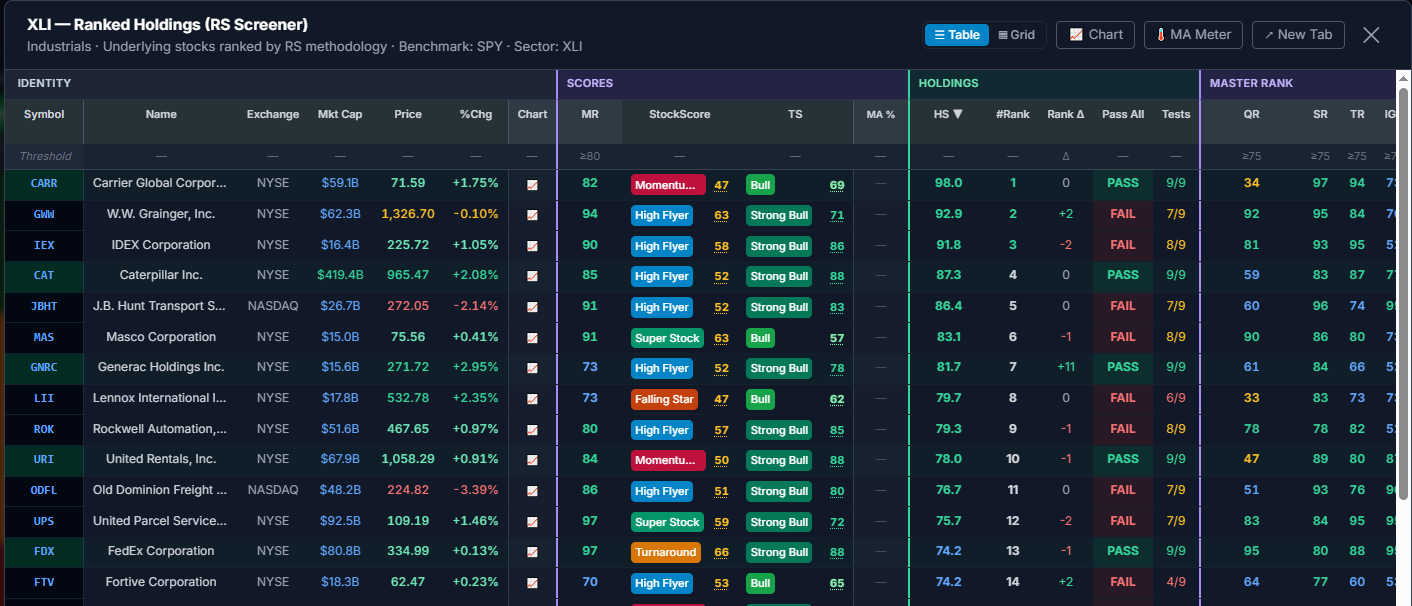
- Sector board shows XLI (Industrials) breaking into the top 3 and climbing fastest over recent intervals.
- You flag XLI as the tactical opportunity candidate — strong rank plus positive rank velocity.
- Open the XLI holdings page, where names are already pre-ranked.
- Filter to top-ranked holdings with a strong technical and stock score.
- Remove names that are already overextended vs ATR / 10 EMA.
- Keep only those with a positive entry signal.
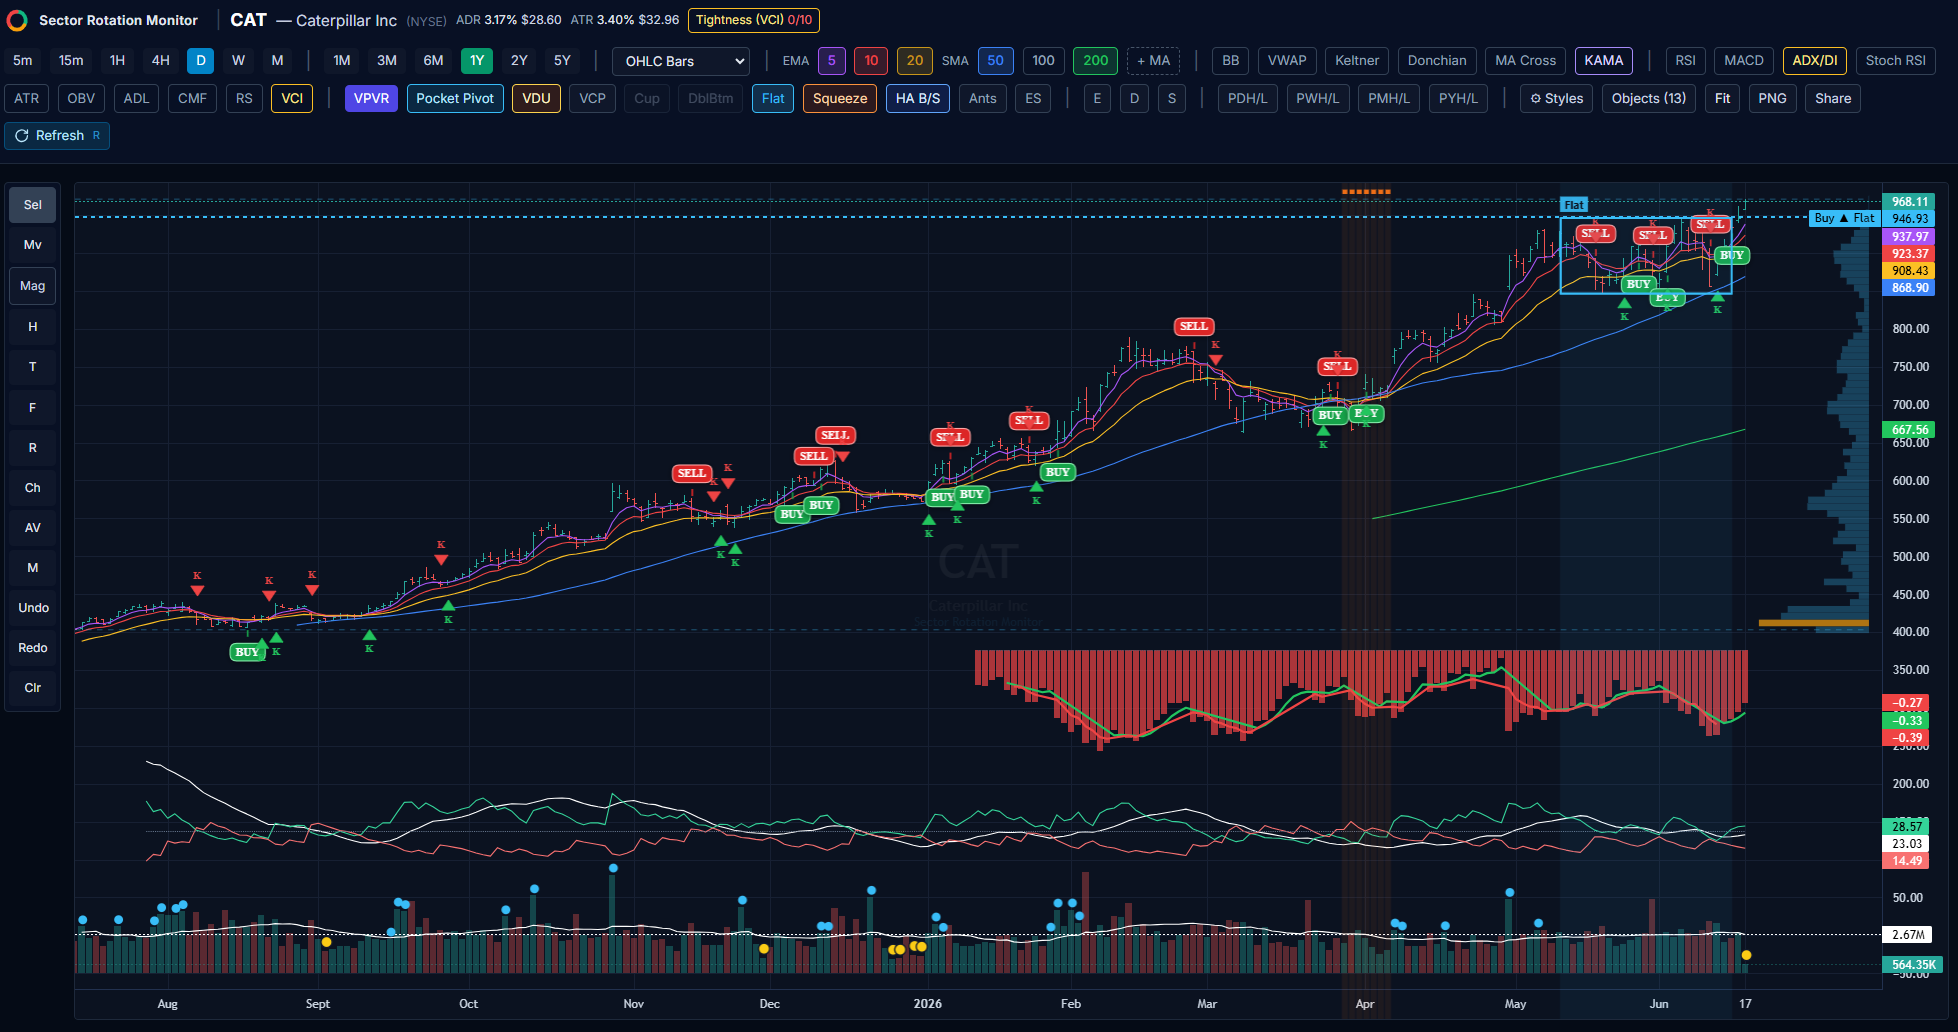
- Execute one of two ways:
- ETF trade in XLI for clean sector exposure, or
- Single-name trade in the top filtered holding for higher potential alpha.
This keeps decisions systematic and reduces random stock picking.
Why This Approach Works Better Than Isolated Stock Picking
Most failed trades are not stock-specific mistakes. They are context mistakes.
If sector and regime are against you, even good stocks can struggle.
The process here is context-first:
- Macro and regime,
- sector leadership,
- then stock-level confluence,
- then entry signal.
That sequence improves selectivity and risk-adjusted outcomes.
Who This Is For
- Investors who prefer ETF-level rotation.
- Swing traders who want stock-level entries inside leading sectors.
- Beginners who want a clear framework instead of social media noise.
- Advanced users who want a repeatable process with confluence rules.
This is not financial advice. It is a structured decision-support workflow.
Call to Action
Markets rotate. Opportunity rotates with them.
Use Sector Rotation Monitor to identify leadership, validate confluence, and execute with discipline.
Updated: April 2026